There are many approaches. I tried an approach using simple but robust imaging techniques with a database and statistical / probability calculations. The process consists of calibrating a relationship between 3 shades (white, grey and black), with a database containing the extremes and probably number of larvae and the quality of the estimation.
Fish Counter Overview
Fish Counter How to estimate the number of live objects, which are in constant motion, in an industrial setting, using machine vision? An estimation of the number of larvae fish, in a basin, for aquaculture is necessary in order to calculate livestock value, food requirements and cost. But it is a difficult machine vision application (it is difficult for humans).
https://www.michael-spratt.com/wp-content/uploads/2021/02/Histogram-1.gif
The results of this study was published Fish Quality Control by Computer Vision – (Pau/Olafsson) Spratt M., (1991) – Fish Quality Control by Computer Vision – (Pau/Olafsson) – Preliminary Results of a Computer Imaging System Applied to Estimating the Quantity of Larvae and Fingerling Fish for Aquaculture. – January 1991, Marcel Dekker, Inc. p 263-281.anced settings.
Image Processing
A computer processes an image in rows and columns, much like a spread sheet (i.e. 512 x 512). A pixel is at the intersection of a line and column and the computer stores a value for each pixel. In most cases the value is between 0 and 255 representing the number of photons which strike the sensor associated to a pixel. 0 for no photons, or black and 255 for photon saturation, or white.
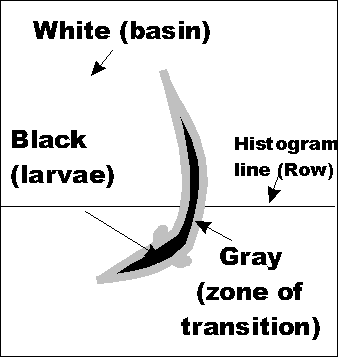
Thus an image of a fish, to a computer, is a series of values (i.e. grey levels) organized into rows and columns. As seen from above, a larva is black against a white background. A zone of transition surrounds each larva as it moves about the basin. Histogram The line drawn through the image and the larva (see above) is represented graphically*. The dip in the graph represent the larva. A transition zone exists between the basin and larva. * A histogram is graphic representation of the pixel values found in an image.
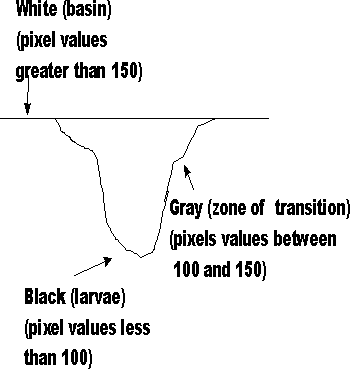
As an image is composed of numerical values, a computer can rapidly manipulate then. In this case an “input look-up table” converts incoming grey scale values to another grey scale value.
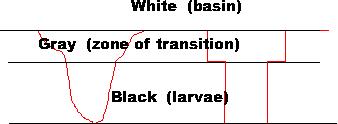
For example : all pixels with a value of 100 or less are converted to 0 (all dark shades are converted to black), all pixels between 101 and 150 are converted to 128 (the mathematical center of the grey scale), all pixels greater than 151 are converted to 255 (all light shades are converted to white). The histogram before and after the input look-up table converts the pixel’s values. The conversion of the image into three grey levels is done upon input, in real time (25images/second)
Image Manipulation
As an image is composed of numerical values, a computer can rapidly manipulate then. In this case an “input look-up table” converts incoming grey scale values to another grey scale value.
For example : all pixels with a value of 100 or less are converted to 0 (all dark shades are converted to black), all pixels between 101 and 150 are converted to 128 (the mathematical center of the grey scale), all pixels greater than 151 are converted to 255 (all light shades are converted to white). The histogram before and after the input look-up table converts the pixel’s values. The conversion of the image into three grey levels is done upon input, in real time (25images/second)
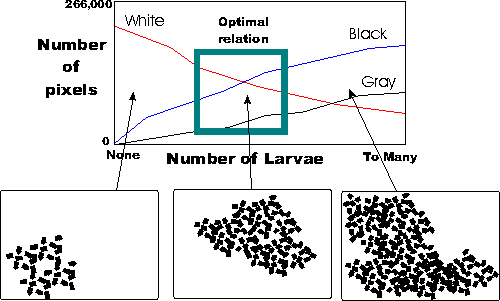
ere are many approaches. I tried an approach using simple but robust imaging techniques with a database and statistical / probability calculations. The process consists of calibrating a relationship between 3 shades (white, grey and black), with a database containing the extremes and probably number of larvae and the quality of the estimation.
Fish Counter
Fish Counter How to estimate the number of live objects, which are in constant motion, in an industrial setting, using machine vision? An estimation of the number of larvae fish, in a basin, for aquaculture is necessary in order to calculate livestock value, food requirements and cost. But it is a difficult machine vision application (it is difficult for humans). The results of this study was published Fish Quality Control by Computer Vision – (Pau/Olafsson) Spratt M., (1991) – Fish Quality Control by Computer Vision – (Pau/Olafsson) – Preliminary Results of a Computer Imaging System Applied to Estimating the Quantity of Larvae and Fingerling Fish for Aquaculture. – January 1991, 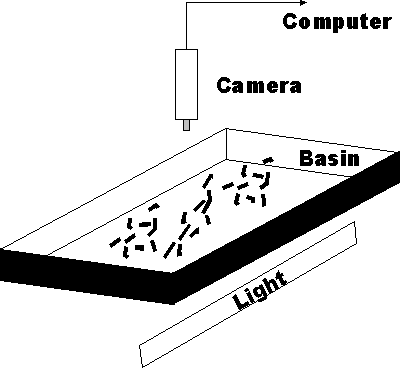 Marcel Dekker, Inc. p 263-281.anced settings.
Potential
As an image is composed of numerical values, a computer can rapidly manipulate then. In this case an “input look-up table” converts incoming grey scale values to another grey scale value. For example : all pixels with a value of 100 or less are converted to 0 (all dark shades are converted to black), all pixels between 101 and 150 are converted to 128 (the mathematical center of the grey scale), all pixels greater than 151 are converted to 255 (all light shades are converted to white). The histogram before and after the input look-up table converts the pixel’s values. The conversion of the image into three grey levels is done upon input, in real time (25images/second)