 |
SAP
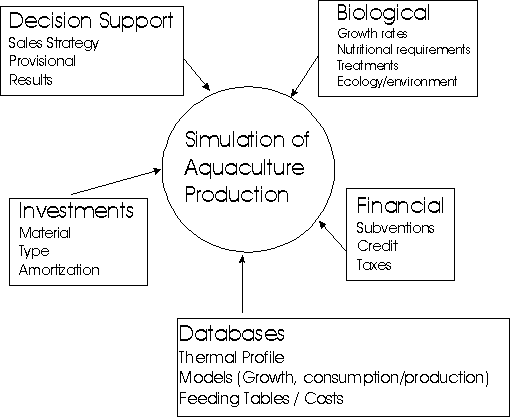
Simulation of Aquaculture Production
SAP(Simulation of Aquaculture Production)
Simulation of Aquaculture Production is designed for long term (5 years) planning and is a very large application containing 11 large sub-tables. These are :
The application optimizes the zoo-technical calculations in order to reduce the size and execution time of the spread sheet. Since economical results are calculated on a quarterly basis only quarterly zoo-technical data (food costs, sales, etc.) is required. The problem is how to initiate a series of calculations, then select, recover and store the results from one of the lines which is among all the other rows.
An Execution Macro Command (EMC), \X, was developed to reduce the size and execution time for a simulation. The execution macro limits execution to the lots and quarters specified and controls how the data is processed and stored in the detailed production area. The technical details of this macro command are described in the Macro section.
Over View
By integrating biological, financial with chronological information this simulations combines both economical and environmental information.
|
When using the application :
Note : Everything in color, ie. blue or green, (this depends upon how your program ie. Excel, Lotus, Visicalc, etc., is configured), is what the you can change to adapt the spread sheet to your examples.
|
Note : To execute the simulation press "alt X". A macro program is used to control and reduce the number of calculations and the time required to run a simulation. |
Business
Control
(credit, subvention, taxes, etc..)
FINANCIAL
|
PRODUCTION CONTROL
|
The basic strategy for simulation combines Financial and Production considerations, all the modules are interconnected, so it is important to understand the effects of modifying data values. This is particularly true in the business control area.
Documenting each different configuration will help you to create a varity of scenarios.
Beginning Date - this is the starting date which is transformed into a week number and year. This determines the temperature returned from the Thermal Profile, which in turn effects growth and all other the calculation performed. It is important that the Starting Date be contained in the Thermal Profile time period.
The Financial elements (i.e. loans, subventions or grants received and loan and interest payments) are important and will have profound effects upon production costs.
The amount of money required to pay for production, fixed costs, personnel and investments will be borrowed and repaid based upon these pre-establish values. It is important to control and evaluate the values stored here.
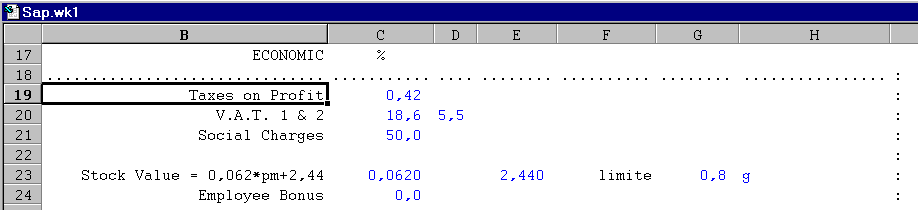
Economics includes the social / political infrastructure of the installation, which are listed below.
Taxes on Profit - Defined by fiscal law, this is the percentage of profits the government will tax.
VAT 1 & 2 - These are the two different percentages of VAT one for commerce the other agriculture.
Social Charges - Percentage of salaries which the employer pays to the various government (retirement, illness, education, etc.,) in the form of charges.
Stock Value - The end-of-year stock value is used to calculate the value of the live stock based upon their weight multiplied by a coefficient and a constant. The minimum weight is 8 grams.
Employee Bonus - A percentage of the profit to be given to employees as a prime.
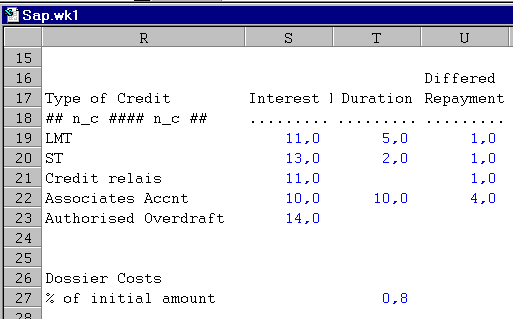
Credit is defined as the type, the amount, the length, the interest rate and the number of years of repayment.
LT (Long Term) Loan - Long and medium term loans are for investment only, which guarantees the loan. The duration of the loan must not exceed the life of the investment and the loan repayment maybe deferred one year
ST (Short Term) Loan - These loans are for 1 to 2 year and used mostly for operating cost or "projects".
Credit Relay - This is an "overdraft" loan which is activated should the authorized overdraft be exceed.
Associates Account - Funds available from associates, which have financial charges associated with the loan.
Authorized Overdraft - Used to cover monthly overdraft, this type of loan has a high interest rate and must be repaid each month
Dossier Costs a percentage of initial loan - An initial cost of establishing a dossier is calculated based a percentage of the first loan.
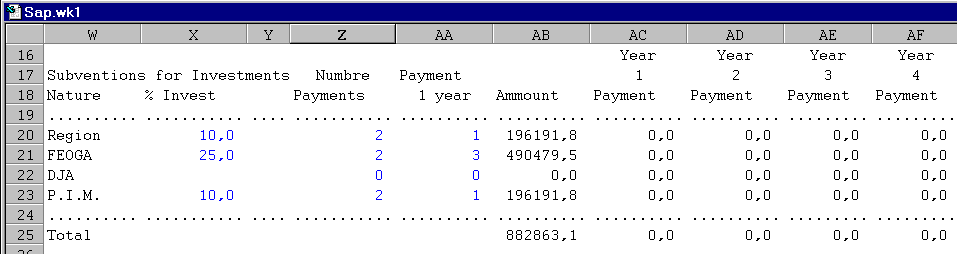
Subventions include the nature or source, the amount and number of payments and the first year it is to be received. A subvention can also be based upon a percentage of investment. The money obtained from grants and subventions are included in the assets and liabilities.
Nature - Type or source of subvention.
% of Investment - the percentage of total investments which will be subventionned.
Number of Payments - the number of payments to be made.
Payment delay in years - the expected delay (in years) before being paid.
The Production Control Area of Business Control influence the biological aspects of production. This region controls the lots, when they are to be placed into production, stopped and sold. It also controls the cost of food and variable charges.
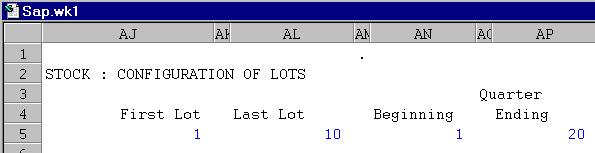
Lots contains the data which controls the execution, grouping into lots and simulating growth of Seabass. Up to ten different lots can be established and each placed into production at a specific date. The characteristics of the temperature profile, daily growth rate and daily feeding table are used to determine the daily growth factors, summarized weekly, then quarterly and yearly.
The control of a lot's execution is performed by the configuration values. The operator can limit the execution of the lots by fixing the range in First Lot & Last Lot and limit the quarters by modifying the Beginning & Ending Quarter. Plus, the status must be set to 1 and the quarters must be within the first and last quarters to simulate
Thus a simulation can be limited to specific lots (i.e. lots 3 through 7) and specific quarters (i.e. quarters 1 through 4 or the 1st year).
In the example above all the lots, from 1 to 10 will be executed, starting from the first quarter to the 20th (last quarter)
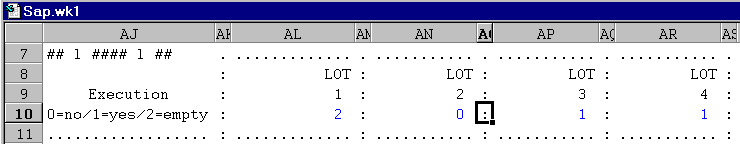
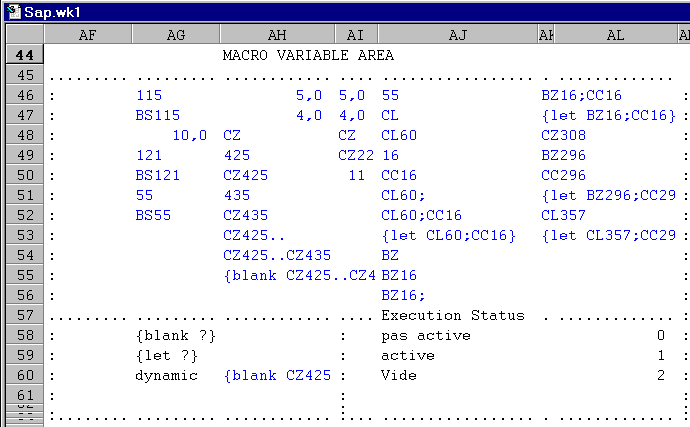
The execution of each Lot is independent and controlled by the Execution Status value. Currently 3 values exist :
0 - Ignore (skip) the lot
1 - Execute the lot (calculates simulations)
2 - Empty the current contents of Lot (removes all values for the Details of Production)
In the example LOT#1 will be emptied from the Details of Production table. LOT#2 won't be executed, if there are results stored in the Details of Production table they will be main. LOT#3 will be calculated.
Lots A lot is defined by the :
Starting Date - the date from which the lot will enter into the calculations.
Number of Individual initially - initial number of individuals
Mean weight - initial average weight
initial value of an individual - the real (or estimated) value of an individual
weekly mortality (estimated) - a fixed rate of deaths for the simulation period.
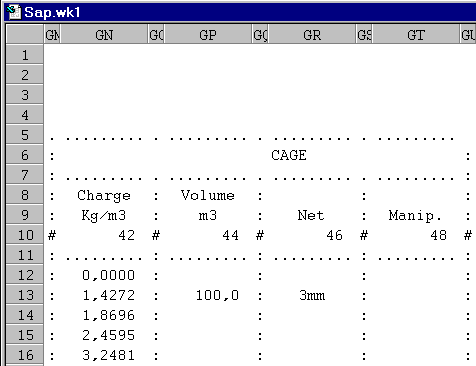
A lot also contains information needed for environmental appreciation cage volume and depth, in relation to the water currents.
A lot has a starting date, number, mean weight and cost per individual and projected weekly mortality. The simulation for each lot ends, when a predetermined date, mean weight or biomass is reached. Income is generated by the sale of the lot for a predetermined price per kilo. If no sales price is present when a lot has reached its stopping criteria the effect is similar to splitting a lot into different cages.
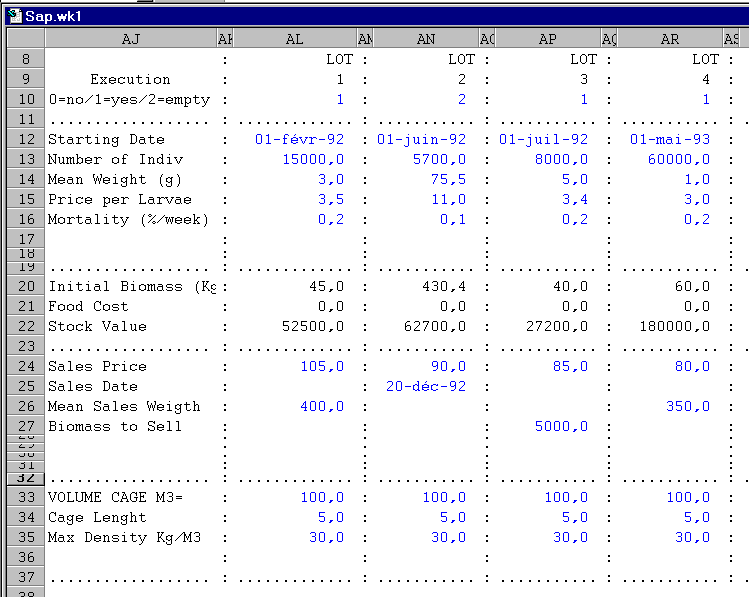
The Initial Biomass, Food Cost and Stock Value are calculated from the initial data.
Once a condition for stopping a lot has been reached the simulation will sell the animals at the Sales Price thus generating income.
Production of a lots is stopped when a
Sales Date is reached,
a Mean Sales Weight per fish is obtained or the
Biomass to Sell has been reached
The Volume of Cage and Max Density are presented for information purposes while the Cage Length is required to calculate current speeds and cage recycling rates.
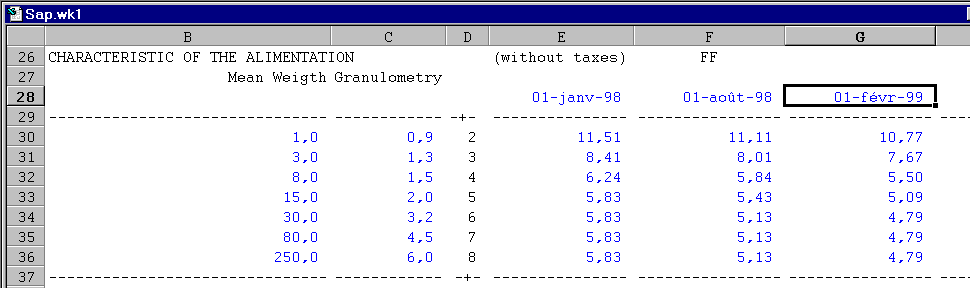
CHARACTERISTICS OF ALIMENTATION
Alimentation is presented in a two dimensional table with the granule (row), the purchase date (column). Their intersection contains the price paid per kilo of food. Seven different types of "granule" can be defined and purchased at 12 different dates.
The user "estimates" the date and price per kilo (without taxes) and the computer will calculate the cost, based upon the mean weight of fish the date and the daily feeding table.
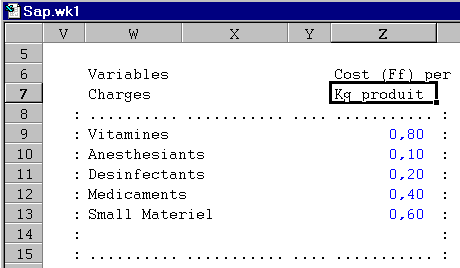
Variable Charges, such as vitamins, anaesthesants, disinfectants and medicines can be calculated based upon a ratio of cost per kilo of production.
Geo-physical
(Thermal
Profile, Daily
Growth Model, etc.)
GEO-PHYSICAL
The Geo-Physical area contains the site and species information. They are grouped together as they combine the key technical information concerning the fish and the environment. This knowledge will help to define reasonable expectations and limits for production.
For further information see ZOO_TECH and SIM_REAL
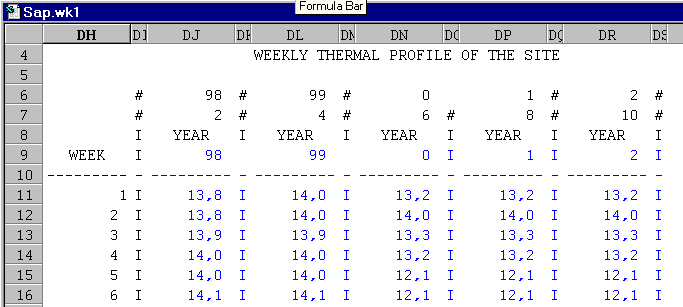
The Thermal Profile of the Site is very important as it has a major influence upon growth. The water temperature at the site must be know or estimated for the weekly temperature for 5 years. Closed and semi-closed system are easily simulated as the temperature is constant.
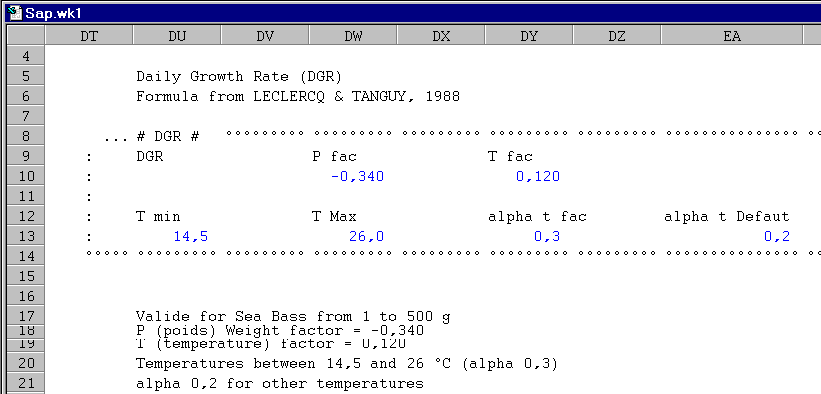
Daily Growth Rate controls the weekly weight gain on a daily basis. It is a general model (used by IFREMER) for Sea Bass between 1 and 500 grams and a temperature between 14.5 and 26 °C.
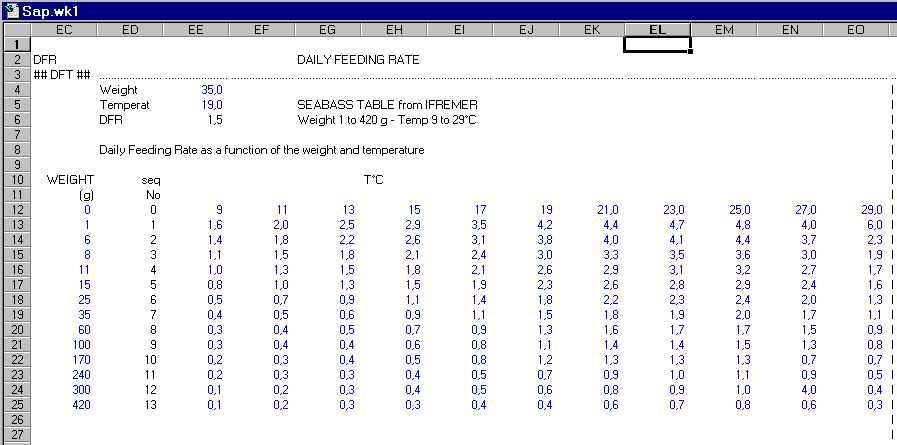
Daily Feeding Table (DFT) The DFT contains the mean fish weight (row), the temperature (column) and the manufacture's suggested daily percentage of food in relation to the biomass (intersection). The Daily Feeding Tables is for SEABASS DAILY FEEDING TABLE (from IFREMER), Weight 1 to 420 g Temp 9 to 29øC
Environment summarizes quarterly biological production (material in suspension, nitrates/nitrites) and consumption (oxygen) indications.
Nitrate & Nitrogen Production
Food to Nitrate Production, ammonium and organic nitrogen production rate, in grams is calculated using the amount of food provided - i.e. 30 grams and 42 grams respectively, produced per Kg of food given to the fish.
Total nitrate & nitrogen production is calculated as grams per Kilogram of food provided. Default values are :
NH3+NH4 = 30.0 g/Kg Food
N total = 42.0 g/Kg Food
Suspended Particle Production
The conversion of food to particulate matter (P.M.) is a coefficient, calculated using a constant (i.e. 33,0) multiplied by the conversion rate minus a constant, i.e. 20,0.
P.M. = (33.0 *CR) - 20.0
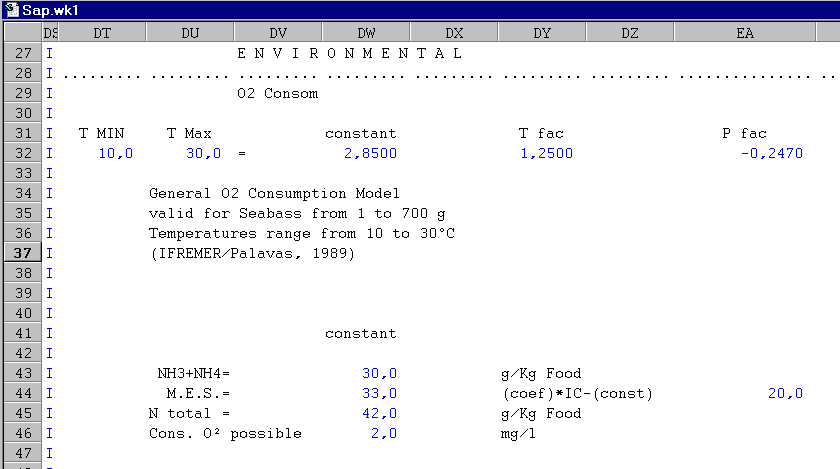
Oxygen Consumption
A O2 consumption model works on the same principle as the Daily Growth Model, that is an initial mean weight and weekly temperature.
Daily O2 Consumption = 2.8500 constant 1.2500 (T fac) -0.2470 P facThe factors of this calculation are :
Daily O2 Consumption Rate is a mean hourly rate in mg per liter.
An initial value of 2mg of O2 per liter present the normal amount of dissolved oxygen (O2), in mg per litter of sea water.a Temperature range from a minimum of 10.0 °C to a maximum of 30.0 °C
General O2 Consumption Model valid for Seabass from 1 to 700 g Temperatures range from 10 to 30°C
(IFREMER/Palavas, 1989)
Zoo-technical
(conversion index, growth rate, etc..)
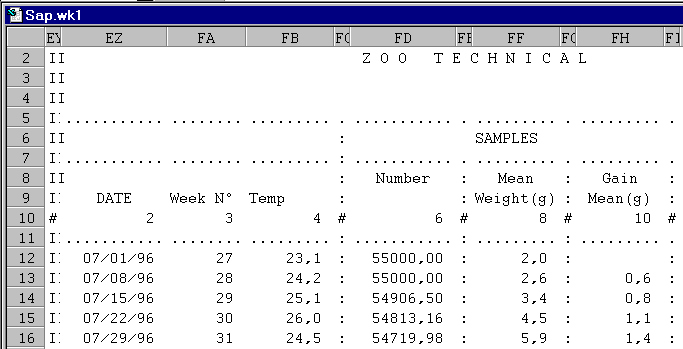
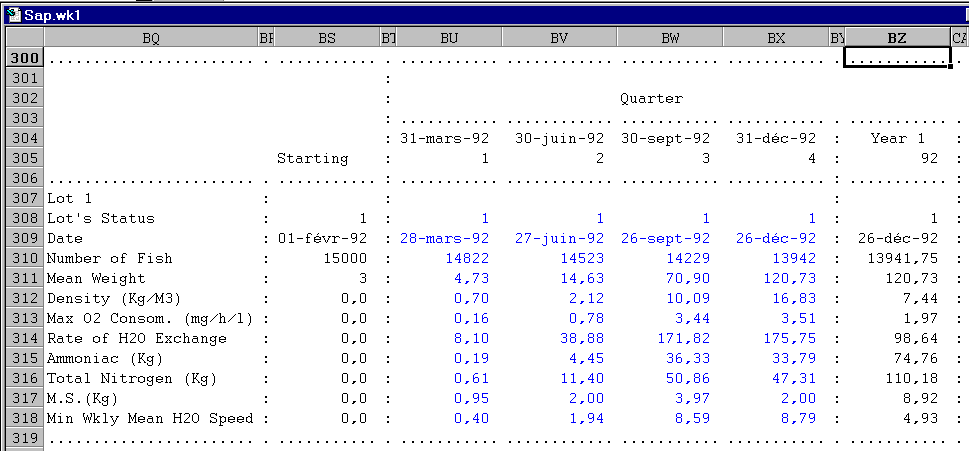
The Zoo-Technical table calculates the various values required to simulate production. The calculations are based upon daily activities, which are summarized by week. At least 12 weeks of simulation are required in order to calculate one quarter.
The calculations performed in this area are the date, week number, mean temperature, number of individuals, mean weight, mortality, total mortality, biomass, daily feeding rate, daily growth rate, food costs, density etc.
Date (1) - The date contains the initial or previous date plus the time step.
Week number (2) - The date is converted to the week number.
Temp (3) - The temperature is obtained from the site's Thermal Profile. This two-dimensional "look-up" table is access via the year and the week number, both are obtained from the date.
Number (4) - The number is the result of the initial or previous number minus the weekly moralities.
Mean Weight (g) (8) - The mean weight is calculated using the Growth Rate Model, initial or previous weight and the mean weekly temperature.
Gain Mean (g) (10) - The gain in mean weight is the difference from one week to the next.
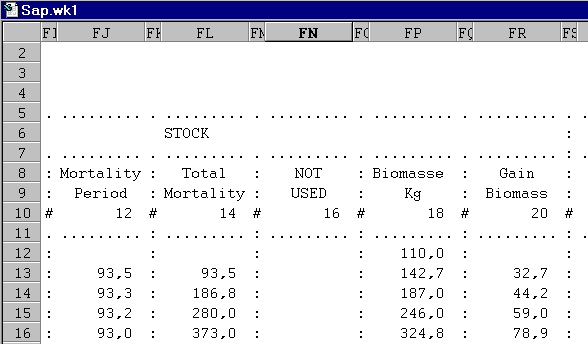
Mortality Period (12) - Mortality is the result of multiplying the percentage of mortality per week by the number.
Total Mortality (14) - Cumulating deaths for the period provides a "running total" of all deaths.
Not Used (16) - Any additional calculation can be entered into this column.
Biomass Kg (18) - The product of the mean individual weight and the number of individuals.
Gain Biomass (20) - The difference in biomass from one period to another.
Daily Feeding Rate (DFR) (22) - The value present here is obtained using a two-dimension look-up of the Daily Feeding Table. The DFR is the percentage of food required for a given biomass which is a function of the temperature and mean weight of the animal.
Food Kg (24) - The alimentation provided is the product of the DFR and the biomass.
Total Food (26) - The running total of alimentation provided.
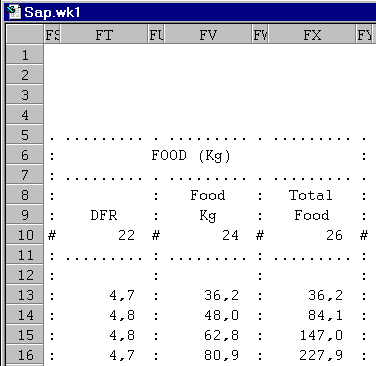
Daily Growth Rate (DGR) (28) - This value is obtained using the Daily Growth Model, Thermal Profile, and the individual weight of the organism.
Conversion Rate (also know as Conversion Index) (30) - The result of dividing the total aliments by the biomass.
Food Costs (32) - The weekly cost of food based upon the total aliment (14) and the food characteristic table.
Total Food Cost (34) - This is the running total of alimentation costs.
Price (in cost per Kg) Direct Food Cost (36) - This is the cost of producing a Kilogram of fish, in food cost only.
Value of Individual (38) - The value initial plus the value of the food distributed per individual.
Price per Individual in Food (40) - The value of an individual in the cost of food it has consumed.
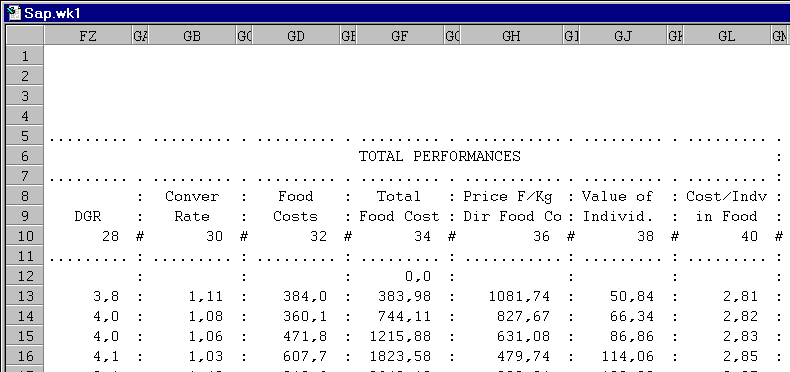
Charge Kg/M3 (36) - The density or biomass per cubic meter.
Mean weekly Consumption of O2 (53 & 55) - Using the O2 consumption model, the mean weight and temperature the consumption is calculated in mg per hour per Kg and mg per hour per litter.
% Renewal per Hourly -(Minimum) (57) - This calculation is based upon the length of the cage in relation to the predominate current, the biomass and the maximum concentration of O2 in solution.
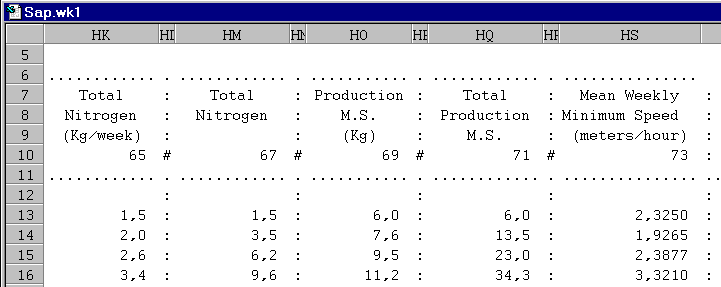
Production Ammoniac (Kg/week) (61) and Total Production Ammoniac (63)- The amount of ammoniac produced is the product of the Kg of food provided and the NH3 + NH4 factor established above.
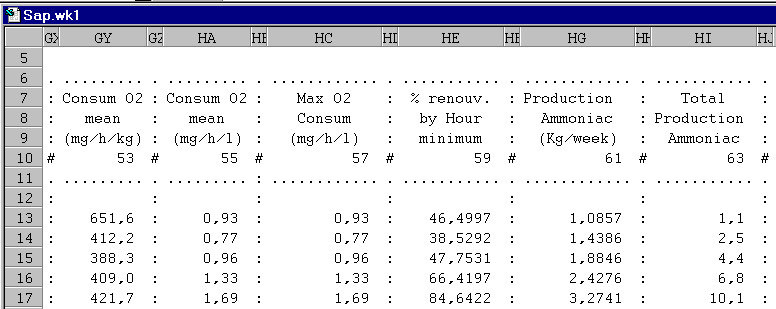
Total Weekly Nitrogen and Total Nitrogen Produced (65 & 67) - Like ammoniac, nitrogen production is the product of the Kg of alimentation distributed and the N coefficient described above. Total nitrogen produced is a running total of all N produced.
Total Production of Particulate Matter (M.S.) & Total Production of Particulate Matter (M.S.) (69 & 71) - This metabolic by-product is calculated as the product of P.M. coefficient (described above) and the conversion index minus a constant i.e. 20.
Mean Weekly Current Speed (minimum in meters/hour) (73) - This value is calculated using the cage length and the percent of renewal per hour required to flush the cage with oxygenated water.
Details of
Production / Environment
(food, biomass, etc.)
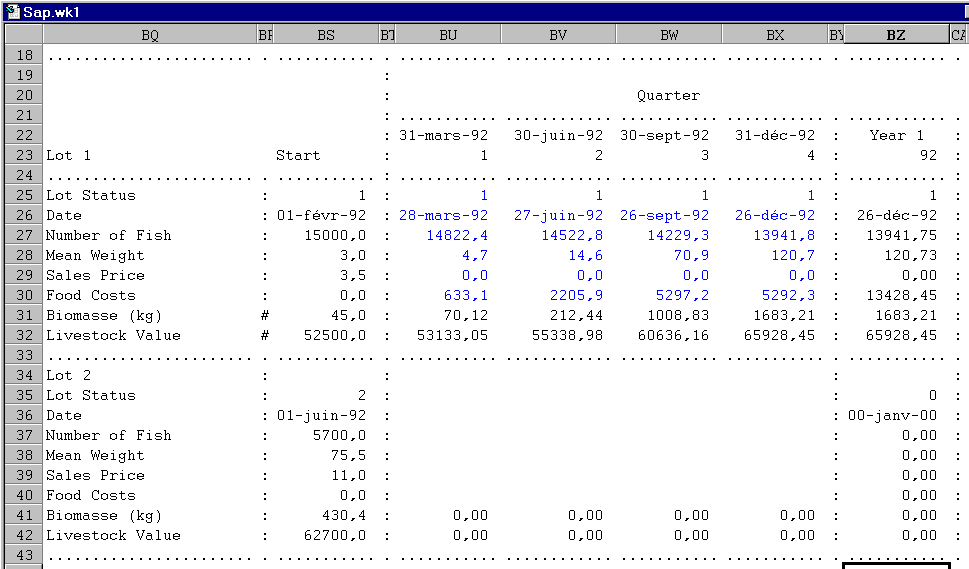
Details of Production and the Environment are three dimensional tables, containing the initial values for each of the ten lots (rows) and the ending date of each quarter (column).
The intersection contains the lot's status, exact date, (nearest the end of the quarter), number of individuals, mean weight, sales price (if sold) and food costs. The biomass and value of the lots are calculated from the above information.
PRODUCTION RESUME
Production Resume is a quarterly and annual summary of livestock purchases, including the VAT, income from sales, the biomass produced, food costs, variable charges, fixed costs and the variations in the value of the livestock from year to year.
Lot 1 - the number of the lot established in the Production control area, Lots
Lot Status - 0 - Ignore the lot (skip)
1 - Execute the lot (calculates simulations)
2 - Empty the current contents of Lot (removes all values for the Lot)Date - this date is the closest date to the end of the quarter column). The next quarter begins with ending date of the last quarter.
Number of Fish - the number of individuals remaining in the lot.
Mean Weight -the mean weight of an individual, at the indicated date.Sales Price - if a sales condition (sales date, mean weight or biomass) was met the cheptel was sold at the predetermined price per kilo, which earned the amount indicated by the sales price.
Food Costs - the cost of food provided during the quarter
Biomass (kg) - the biomass of the lotLivestock Value - the original value of the lot, plus the cost of food summed for each quarter.
Details of Environment contains summary information concerning the mean and maximum O2 consumption in mg/h/kg and mg/h/l, the required minimum percent of hourly exchange and the weekly and total production of ammoniac.
Details of Environment contains summary information calculated weekly but summarized by quarter. The following table describe the weekly calculations.
Mean weekly Consumption of O2 (53 & 55) - Using the O2 consumption model, the mean weight and temperature the consumption is calculated in mg per hour per Kg and mg per hour per liter.
Minimum % Renewal Hourly (59) - This calculation is based upon the length of the cage in relation to the predominate current, the biomass and the maximum concentration of O2 in solution.
Ammonia and Total Ammoniac (61 & 63) - The amount of ammoniac produced is the product of the Kg of food provided and the NH3 + NH4 factor established above. The total ammoniac is a running total of all ammoniac produced.
Total Weekly Nitrogen and Total Nitrogen Produced (65 & 67) - Like ammoniac, nitrogen production is the product of the Kg of alimentation distributed and the N coefficient described above. Total nitrogen produced is a running total of all N produced.
Mean Weekly Minimum Speed (in meters/hour) (73) - This value is calculated using the cage length and the percent of renewal per hour required to flush the cage with oxygenated water.
Production of Matter in Suspension and Total Production Matter in Suspension (M.S.) (69 & 71) - This metabolic by-product is calculated as the product of P.M. coefficient (described above) and the conversion index minus a constant i.e. 20.
This table summarizes the above environmental calculations by Lot, quarter and year.
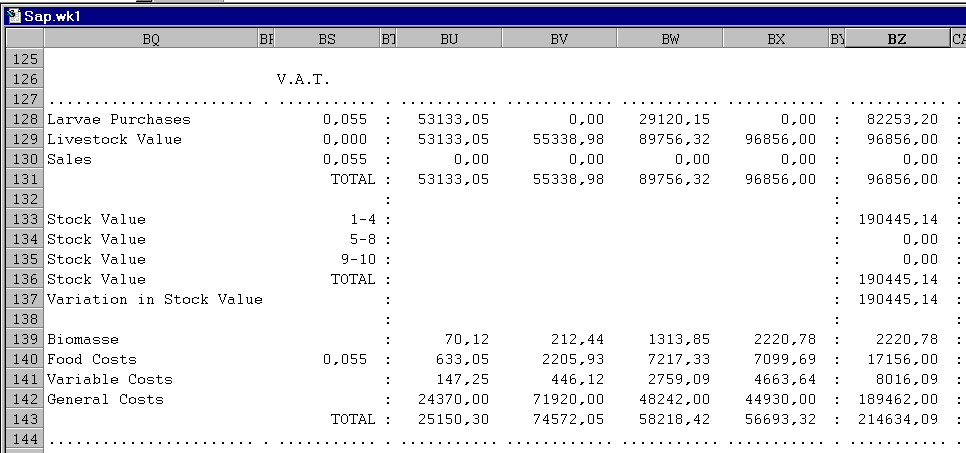
Charges are divided into variable, fixed and salaries. This information is essential in order to estimate and control costs. Careful completion of these tables will provide valuable insight into the operation of the installation. Once established they remain relatively static and provide a base of support while modifying other variables.
Larvae Purchases - the value of a lot when it is placed into production
Livestock Value - the value of all the lot, being produced, plus the cost of food for the quarter.
Sales - the amount received for the sales of fish
Stock Value (1-4) - the value of lots 1, 2, 3 and 4 December 31 of the current year, for accounting purposes.
Stock Value (5-8) -the value of lots 5, 6, 7 and 8 December 31 of the current year, for accounting purposes.
Stock Value (9-10) - the value of lots 9 and 10 December 31 of the current year, for accounting purposes.
Variation in Stock Value - calculates the difference in stock value from one year to the next.
Biomass - the total biomass being produced
Food Costs - the total of all food cost for the quarter and year.
Variable Costs - the total variable cost for all the lots being produced
General Costs - the sum of all the general costs associated with production.
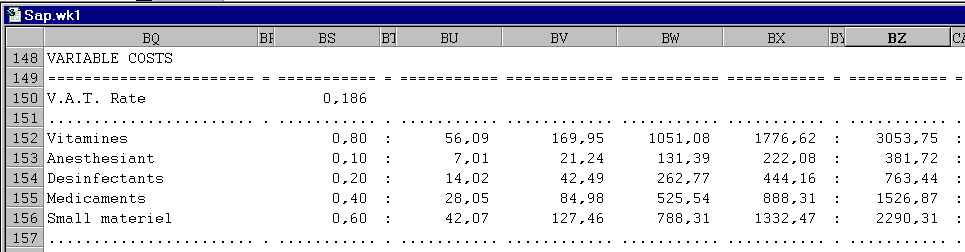
Variable Costs
Variable Costs contain the total cost of vitamins, anesthesants, disinfectants and medicines, calculated quarterly, with the VAT based upon production levels.
V.A.T. Rate - the tax rate is fixed in the control area.
Vitamins - the amount vitamins will cost the site if the rate of .8 units (dollars, French francs, etc.) per kilo of fish produced, plus taxes.
Anesthesia - see the description of Vitamins.
Disinfectants - see the description of Vitamins.
Medicaments - see the description of Vitamins.
Small materiel - see the description of Vitamins.
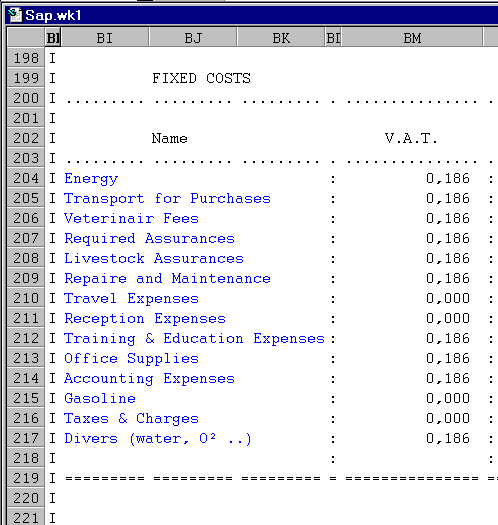
Fixed Costs, such as energy, transportation of purchases, veterinary charges, required assurances, assurance for the lots, repair and maintenance, travel expenses, etc. are estimated by the user on an annual or quarterly basis.
Energy - All forms of energy necessary for the functioning of the installation and for transport intern (boat)
Transport for Purchases - All bills concerning transportation for purchases and sales (purchase of fish, food, medicines, etc.) but excludes transportation for investments.
Veterinary Fees - This item includes subscription to veterinary services, emergency visits, health forms and certificates.
Required Assurances - Required assurances (fire, liability, auto, etc.,).
Livestock Assurances - Assurance against theft, accidental loss, illness, etc.,).
Repair and Maintenance - This includes all up-keep and repair of material purchased as investment. This amount is generally between 5% and 10% of investment.
Travel Expenses - All charges and costs associated with professional voyages, i.e. transport (car, train, boat, etc.,), divers charges (hotel, meals, inscription fees), daily allowance, etc.
Reception Expenses - Charges associated with receptions, gifts, client/supplier good will, etc.
Training & Education Expenses - All material associated with education i.e. reviews, books, etc.
Office Supplies - Necessary for office operation i.e. paper, pencils, staples, etc.
Accounting Expenses -Charges (i.e. stamps, fax, phone, etc.) and service fees (accounting, fiscal advisers, etc.) associated with operations and accounting.
Gasoline - All expenses incurred during voyages for operational reasons (fetch, deliver, escort, etc.).
Taxes & Charges - Charges incurred for certificates, permits, licenses, etc.
Divers (water, O2 ..) - Consumable material and equipment necessary for functioning.
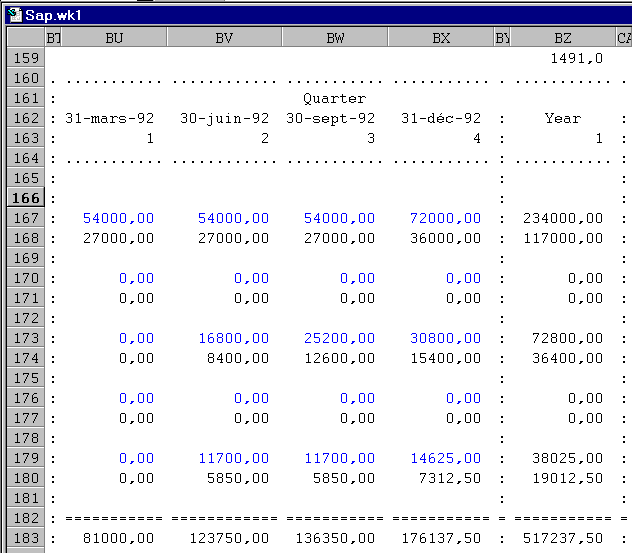
Salaries include an employee title, the number of positions, the monthly salary and the number of months per year they are paid. The calculations consist of the annual charges, plus social charges.
Function - the title of the post
Number - the number of individuals employed at this post.
Monthly Salary (Bruit) - the monthly salary.
Number of Months per Year - normally an annual salary is composed of 12 months, in some case a 13th month can be added to the salary.
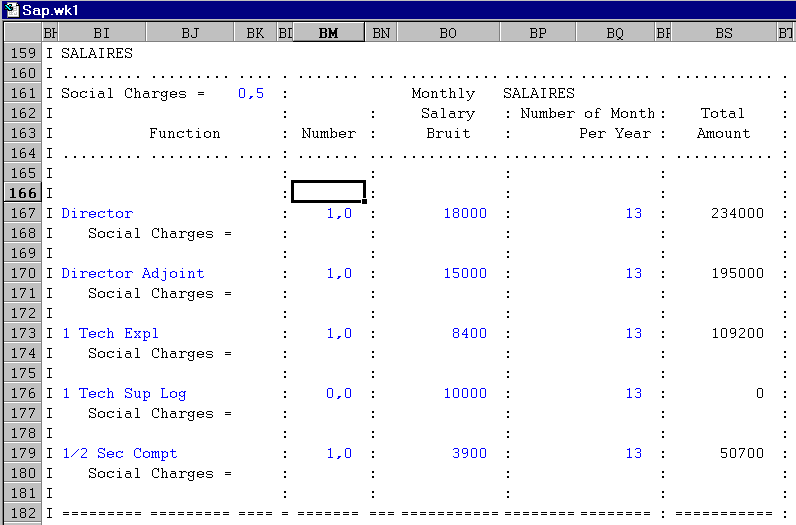
In this example the user enters the quarterly charges.
Investments
/ Amortization
(equipment & material)
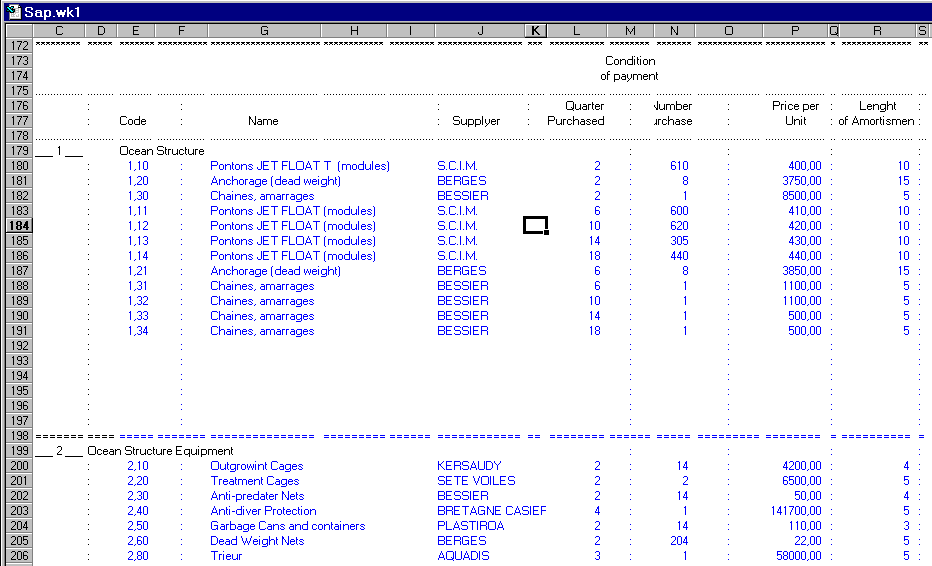
Investments and amortization are important factors when analyzing development options. Details of Investments are defined by a name (and/or code), the purchased quarter, the quantity purchased, the price per unit and the length of amortization.
By modifying the number purchased, purchase date(quarter) and unit prices, quarterly and annual amortization and investment tables will re.
Code - A unique user assigned value used to locate the material.
Name - The name and/or explication of investment.
Supplier - Indicates the source of the investment.
Quarter Purchased - A value from 1 (first quarter of the simulation) to 20 (last quarter).
No Purchased - The quantity or number purchased.
Price per Unit - The individual cost of the investment.
Length of Amortization - The number of years the investment is to be amortized.
This information permits the calculation of the purchase/payment date, the amount, the tax and the total amount paid.
Investments are grouped, depending upon the accounting system and reporting needs.
We have 8 classes of investment :
1) Ocean structures All investments directly related to production (floats, chains, dead weights, etc.), Pontoons (modules) Anchorage (dead weight), Chains, amarrage, ...
(2) Ocean Structure equipment nets, holding cage, anti-bird & diver, etc.,), This is equipment required for production. Outgrowing Cages, Treatment Cages, Anti-predator Nets, Anti-diver Protection, Garbage Cans and containers, Dead Weight Nets, sorter, Sorter Pomp, Outgrowing Cages
3) Construction (leveling, concrete slab, doors, windows, etc.,), all investments made in construction required for functioning. Landscaping, Concrete Pad, Exterior Walls, Hangar, Doors, passage ways, Windows, Interior Walls, Water, Showers, Toilets, Electricity, Paint, tile, etc.
4) Material for functioning, (boat, motor, vehicle, etc.,), investments in material required for the functioning of an installation. Barge, Navette, Motors 4Hp, Van Utility, Chariot gerbeur electric, Transport Tanks, Buckets, ...
5) Production control, (oxygen meter, scale, laboratory material, etc.), material required to insure and verify quality. Pressure Regulator, Material for Environmental Measurements, Dissecting, material, Balance
6) Security and sanitary, (security lights, fire extinguisher, etc.,), all material required to insure safety and health for employees. Surveillance Lighting, First Aid Material, Fire Extinguishers, Off-Shore Radio
7) Processing and commercializing equipment, (ice machine, slaughtering material, etc.,), material required for processing and commercializing of products. Ice Machine (100l/h), Filet Processing, Cold Storage, Cubic Scale
8) General equipment, (office material, diving material, freezer, etc.), general office equipment. Office Furniture, Furniture of Security Post, Dressing Rooms, Secretarial Material, Data Processing Equipment, Diving Equipment, Working Tools and Equipment, Refrigerator, High Pressure Water Cleaner, Machine for cleaning nets, Electric Generator, Establishments, Small tools and material, ....
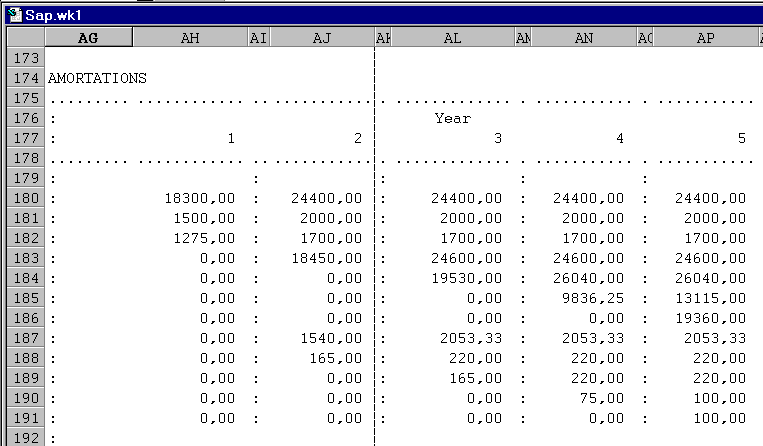
DETAILS OF INVESTMENTS AND AMORTIZATION
The following are two intermediate tables which are used to pre-process and present the annual costs associated with all the investments. These table are used to build the resume of Investments and Amortization tables. These tables should not be modified by the user.
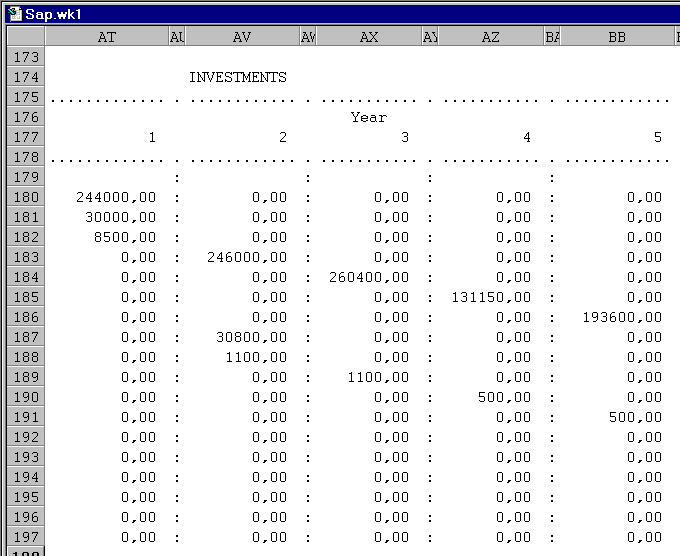
Amortization are calculated on a quarterly basis and present as annually totals.
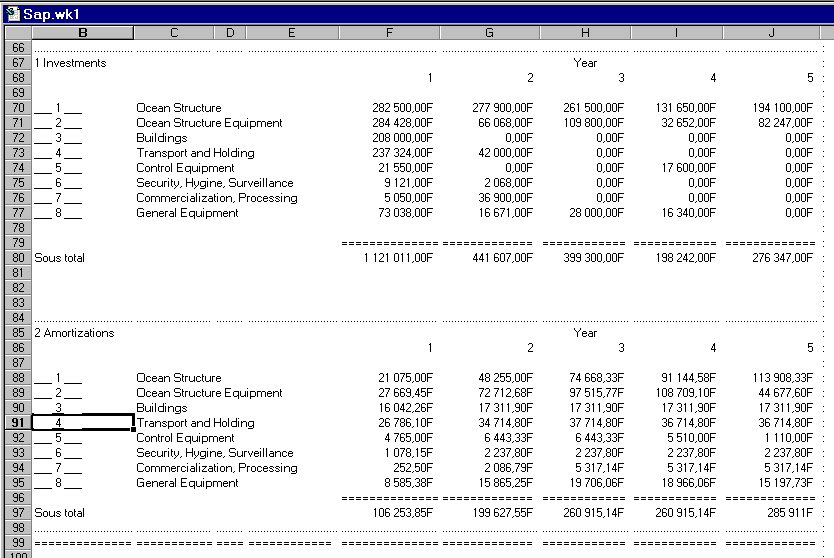
RESUME OF INVESTMENTS AND AMORTIZATION
The resume of investments and amortization calculates the total investment par class and by year which is summarized from the detailed investment and amortization tables.
An amortization table summarizes investment data for the resume of investments. The formulas in this area use the year number of the column as a control activating the quarter's calculation. Amortization is calculated on a quarter basis and totaled by year.
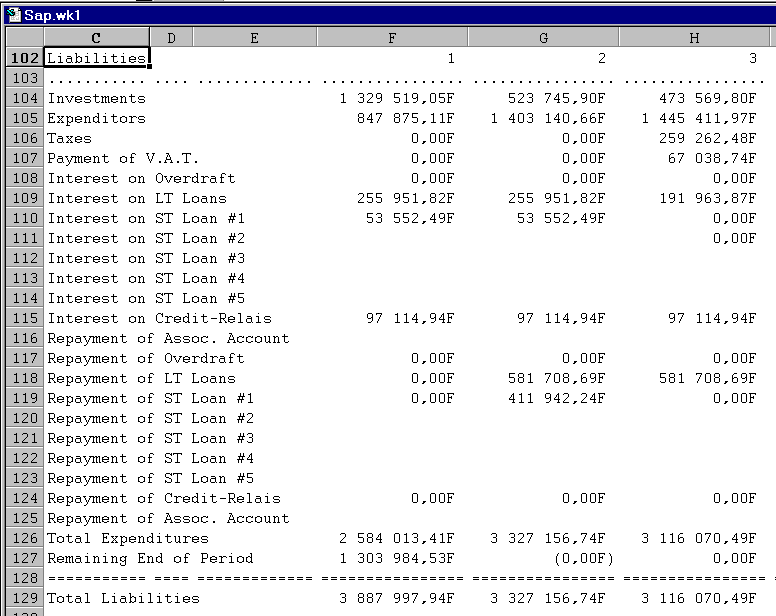
LIABILITIES
Liabilities describes expenditures or the annual outlays and amount remaining.
Investments - This line regroups all investment expenditures, with VAT, plus renewal of investments. An example, a net is purchased in year N for price P, and renewed for the same price (no inflation, constant currency) in year N + 4. The investments are totaled without VAT then the 1 (18.6%) VAT is applied.
Expenditures - This line summarizes all expenses, with VAT, for functioning (purchases) or intern (salaries, taxes, etc.,).
Taxes - This line represents taxes on profit for the preceding year. If the operational benefit is zero or negative the taxes are zero, if there is a profit it will be multiplied by the tax on profits, which is established in the control section.
Payment of V.A.T - This is the difference between the VAT paid and collected in the previous year. If the difference is negative there is no VAT recovered. If the difference is positive then the VAT is the difference.
Interest on Overdraft, LT Loans, ST Loan #1, #2, #3, #4 & #5 & Credit-Relay - These are the interest payments for each loan type
Repayment of Assoc. Account, Overdraft, LT Loans, ST Loan #1, #2, #3, #4 & #5, Credit-Relay & Assoc. Account. These lines summarize all loan re-payments
Total Expenditures -The sum of all outlays.
Remaining End of Period - The difference between all outlays and income.
Total Liabilities - The sum of the total expenditures and remaining end of period.
Assets summarizes the amount of income and available resources.
Available at Start of Period - The amount available from the preceding period.
Capital - Capital from associates for investment.
Assoc. Accounts - Funds made available by associates for operational expenses. This account can generate other expenses intern (i.e. interest).
Subventions - The amount of funds received in the form of subventions.
Payment of VAT - The difference between the VAT paid and received for the period.
Loan Amount LT , Loan Amount CT #1, #2, #3, #4 & #5 - Each line represents the amount of the loan (first time charges and assurance are included in the loan amount).
Sales - All sales, including VAT
Overdraft -The amount of overdraft required for the period plus interest charges.
Subvention for Credit-Relay - Aid provided by the bank in order to anticipate subventions.
Total Assets - The total of the column.
Payment of VAT - The amount of VAT for the year which is to be paid to the government. If the value is negative, this amount is owned to the producer by the government.
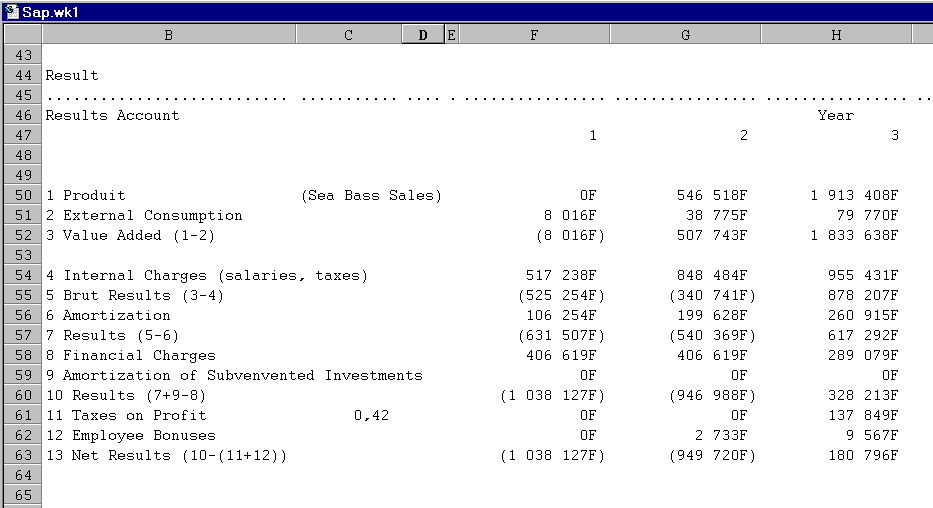
Results over 5 years of simulated production are accumulated in production results.
Product (Sea Bass Sales). -This includes all sales, variation in stock value and subventions
External Consumption . -All purchased consumable
Value Added (1-2) - Product minus External Consumption, or the richness created by the operators
Internal Charges (salaries, taxes) - All charges such as salaries, social charges, taxes, and other para-fiscal charges.
Brut Results (3-4) - Value added minus the internal charges or the value remaining after internal charges have been paid.
Amortization - The annual amortization of all investments.
Results (5-6) - The amount of funds remaining after considering the cost of tools and equipment.
Financial Charges- All interest payments associated with the different forms of credit
Amortization of Subventionned Investments - Subventionned investments are generally reintegrated into exceptional products as they are being amortized.
Results (7+9-8) - The results plus the amortized investments minus financial expenses. This results eliminates the distortion caused by taxing the business.
Taxes on Profit - The amount of money the business is taxed depending upon the tax rate established in the control section.
Employee Bonuses- If the business has a benefit and the employee bonus rate in the control section is positive then the employee bonus is calculated by multiplying the results by the employee bonus rate.
Net Results (10-(11+12)) - The amount remaining to repay loans, pay dividends, etc.
Macro Commands
Several conveniences of LOTUS facilitate access to databases, sub-tables and data. We established three different types of macro commands :
1) Area Location Macro Commands for jumping from one area to another.
2) Exchange Macro Command which copy regions from one spreadsheet to another.
3) Execution Macro Commands for the simulation "\X"
A series of utility macro commands was created in order to move from one region to another and to exchange regions from other spreadsheets.
Commands which relocate the cursor are :
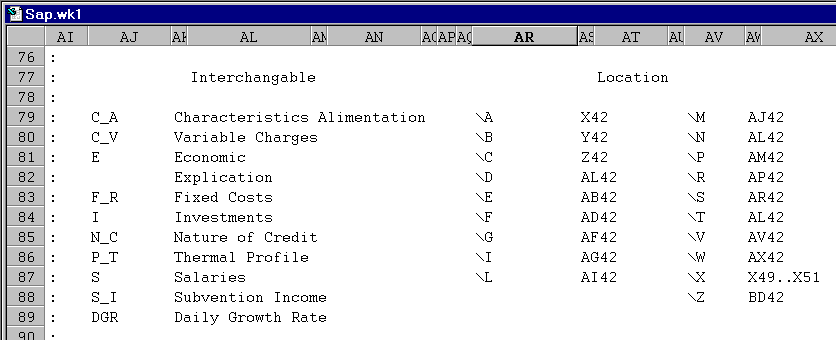
\A - Amortization (Resume)
\C - Results
\E- Liabilities
\F - Fixed Costs
\G- Geo-Physic
\I - Investments
\M - Amortization (Detailed)
\N - Environment
\P - Production Details
\R - Assets
\S - Salaries
\V - Investments (Detailed)
\W - Work (or user programmable)
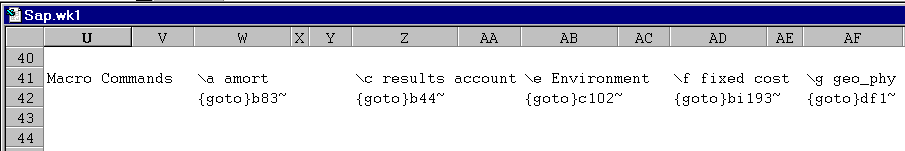
NOTE :
The execution of this simulation is caused by a macro command "\X" for eXecution. Thus to calculate an entire production strategy use \X.
Region names when relocating tables from one spreadsheet to another are :
C_A - Characteristics Alimentation
V_C - Variable Charges
E - Economic
EXPLIC - Explication
F_C - Fixed Costs
I - Investments
N_C - Nature of Credit
T_P - Thermal Profile
S - Salaries
S_I - Subvention Income
DGR - Daily Growth Rate
DFT - Daily Feeding Table
As documented in the Lots section up to ten different lots can be established and each placed into production at a specific date. The characteristics of the temperature profile, daily growth rate and daily feeding table are used to determine the daily growth factors, summarized weekly, then quarterly and yearly. To simulate ten lots, for 200 to 300 weeks (4 to 5 years) would require the multiplication of the zoo technical area. The size of the file would be an insignificant inconvenience, compared to the time to load and backup, and each modification could require minutes to recalculate.
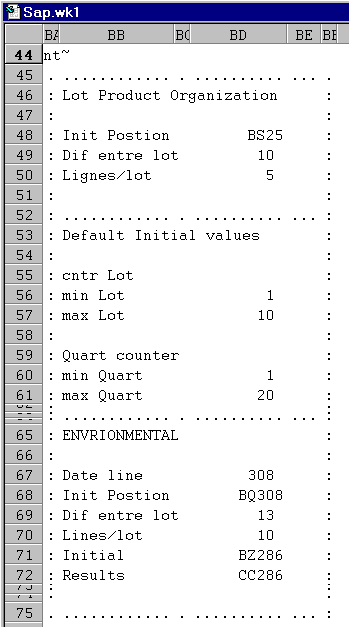
The EMC has a specific control area, which contains and groups key values. These values and variables for essential because they provide the interface between the EMC and the physical locations and sizes of tables such as the Production and Environmental Resumes.
The most important is it also stores the locations and sizes of the two, three dimensional tables (Details of Production and Environment). This information consists of an initial line, the difference between each group, or lot and the number of elements stored per lot.
The column position of each quarter is stored in a two dimensional table, the years in the rows and the quarters in the columns, the intersection contains the column's position.
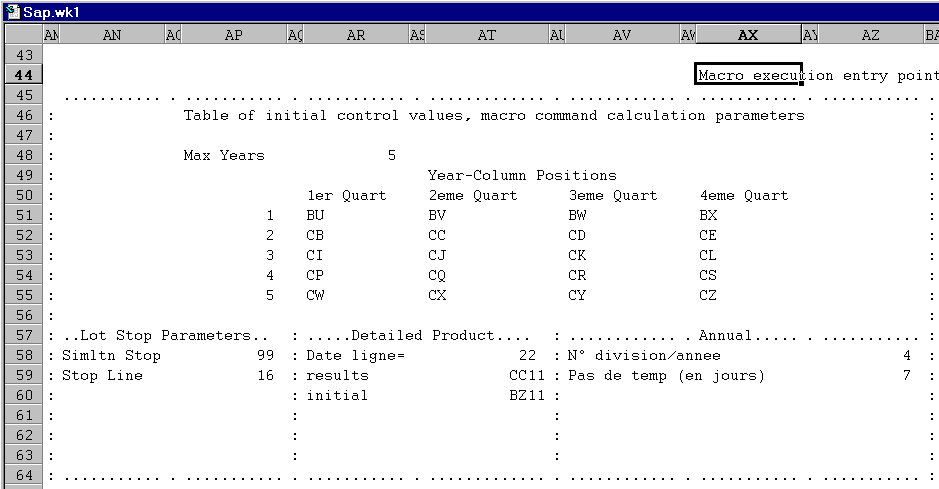
In addition key values for the calculations used throughout the spreadsheet are contained here, for example : days per zoo technical calculation (7: days), divisions per year (4: quarters), number of years for the simulation. The default, minimum and maximum values such as the number of lots (10) and quarters (20) are controlled here in order to prevent user entered data errors.
The EMC makes use of a scratch pad area within the macro command area. This region is used to store the counters and intermediate values used to construct LOTUS commands. The principle is to let LOTUS build and execute the commands required to retrieve and store data. It permits greater user control and it simplifies spreadsheet and macro command enhancements.
It is important that you develop the simulator along different lines in order to serve you, develop aquaculture simulation and computer training.
These simulators mutate quickly because modifications, based upon your needs and situation, are easily performed. The grouping of functions such as geo-physical, zoo-technical, etc., permits rapid adaptation to sites and species. In addition new functions can be easily included. For example simulation of closed and semi-opened systems, other economic situations or countries and markets is possible should you so desire.
The strategy of simulations requires planing and projecting the possible economical, biological and environmental effects of an installation. Projecting is a very precious support for planning and decision making. Every exploitation needs more and more well informed and interdisciplinary personnel, able to face economical constraints and growing technical complexity. The use of this simulator may require special training and technical support. If so do not hesitate to contact us.
The aquaculture profession, as with research and industry, is facing increasing competition, costs, stricter regulations and reporting requirements plus environmental and political pressures. Applied technology is currently providing advantages in many sectors of industry and holds great promises for aquaculture. Therefore it is imperative, that related institutions cooperate in order to exchange information, ideas, technology and solutions and that these exchanges be documented in simulations.
Last updated 08/01/08 05:55:41