

Y-Maze
Overview

The object of this program is to help validate data obtained by our automated Y-Maze Mouse Tracking System and a video film. The goal is to discover why a human observer obtains different results when compared to our automated tracking system.
The screen below displays a tool designed to compare two sources of data; a video file (AVI) and the Tracker data file. The tool is for internal use only and by a qualified user.
The system basically works as follows.
The user selects an experiment with its Session data (Tracker) and it’s corresponding video film. The user then calibrates the video film with the tracker data. Once the two data sources are calibrated they can be “synchronizes”. Thus navigating one data source will cause the other data source to move (forward, backward, skipping, etc.) in the same manner.
User Overview
Thus there are 4 steps the process.
First Step
The user creates an Experiment record which stores all the essential, information concerning an experiment (ie. Date, Planche Number and the starting and ending number of sessions, Session Duration).
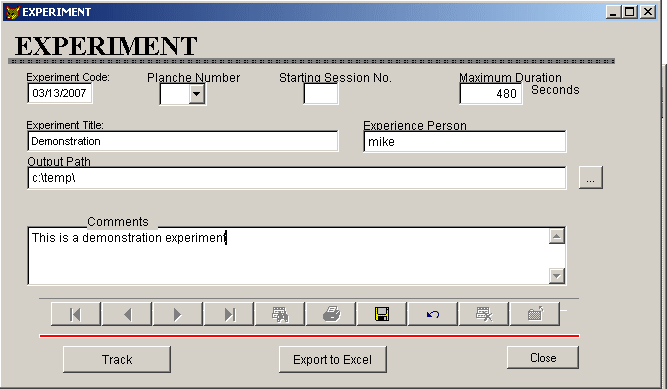
Changing the Session Duration (ie. 480 seconds to 600 seconds) requires creating a new Experiment record.
Second Step
The user then goes to the Tracker screen and starts releasing mice into the “C” arm of each Y mazes on the Planche and starts the tracker program. Every time a mouse passes a sensor, data is written to the Tracker file. Note, that contiguously passing the same sensor will only record the first event and note of the subsequent events.
The session number is augmented and the program waits for the user to release 2 more mice into the Y maze and start the timer. The application repeats the Second Step again.
Third Step
Once the allocated time (ie 480 seconds) has expired the program stops and the Tracker data is copied to a unique backup file. The name of this file created by the application and stored in the designated subdirectory.
Fourth Step
Steps 2 and 3 repeated until all the sessions (Maximum Sessions) are completed or the user stops the process. The entire Tracker file is then stored with a unique name the concatenates of the Experiment Date and Planche number. This file is for exporting to Excel.
Experiment Screen Mask
Tracker Screen Mask
The Tracker file serves as temporary or intermediate file to store session data. Once the sessions are finished, the Tracker file is saved to a uniquely named output file (Experiment date and Planche number).
Several data elements from the Experiment screen mask appear here as a reminder to the user. These elements are the Planche Number, Experiment Code and Maximum Duration of each Sessions in Seconds. A Tracker screen is assigned to a planche number and has a unique color so the user can easily discern the different planche and current session.
![]()
Analyze Different Sources
The object of this tool is to aid enter and process pathway data obtained by human observers.
Process Steps
The user types pathway data into a text file in the following format
Mouse (tab) Pathway
Once the pathways have been entered different programs can process them. For example, the pathway can be analyzed for clock-wise and counter clock-wise patterns, arms counted and the text formatted. The data can also be combined with and compared to Tracker data obtained by our automated tracking system..
Video and Data Validation
Reddish is the Session data. The user selects a Session and which Y-maze (or both) is to be played. The computer then displays the data associated with the session. The starting time is displayed in both Milliseconds and Hour, Minutes, Seconds and Milliseconds.
Pinkish is individual event data. This includes the Y-maze number (1 or 2), the mouse number, its position in the Y maze (Cx, Ci, Ai, Ax, Bi, Bx), and the channel number associated with Y-maze position. Other data is also displayed, such as if this event is part of a hesitation or error sequence, the delta time from the end of the last event to the beginning of this event, the time the sensor was activated and the number of hits (cycles) or times the computer accesses this sensor. Finally the Pathway of the mouse is also displayed.
The greenish area controls the video and data file interactions. Calibrate establishes the relation between the video and the Tracker data. This is done by selecting the first session and locating the start of the first session on the video. This establishes a time (in milliseconds) relation between the video and the Tracker data file.
Checking the synchronize options lock the two files together so the user can navigate both file with one command.
The Video is controlled by the controls located under the image while the Tracker data is controlled by the commands located under the tracker data.
Description of screen layout.
The screen is basically divided into two columns. The left column displays and processes the video file, while the right hand column processes the Tracker data file.
The top row displays the Tracker data (ie. Experiment, date, board, experiment person and the source Tracker data file.
The second row on the left hand side lets the user select the AVI video file associated to the Tracker data file.